Impact
 The labour market impacts on a wide range of social and economic aspects of life in the UK and is accordingly well studied for policy purposes, and well represented in surveys conducted by and for policy makers. Most government surveys contain some questions relating to the employment situation of the respondent however the survey that contains the widest range of employment and training questions is the Labour Force Survey (LFS). This survey is well used; the data were downloaded, or accessed on Nesstar nearly 30,000 times in 2011 alone and have resulted in publications covering a wide range of aspects of the labour market.
Underemployment in the UK in the Great Recession (Bell and Blanchflower, 2011) used the Labour Force Survey from 2009 and 2010 to identify the characteristics of temporary or part time workers who would prefer to be working full time, with men and young people most likely to want full-time work. This research suggests that unemployment figures alone underestimate the extent of disadvantage suffered by younger people as a result of the economic downturn.
On a related theme, Job Search Study: Literature review and analysis of the Labour Force Survey (Green et al., 2011), a report for the Department for Work and Pensions, explores social differences in the methods used by job seekers, including the differential use of internet searches and online social networks. They found that the internet is a particularly well-used method of job search and one that is becoming increasingly important, especially for the young and the well educated. While social networks are not a major method of job search, they form an in important part of the jigsaw that makes up the highly individual combinations of methods job seekers use.
The Labour Force Survey is available in a number of forms: individual or household levels, quarterly or longitudinal, and at different levels of access. The most commonly used is the quarterly, end user licence data. At the individual level, these data are ideal for analyses of individual employment and training and can be used to analyse earnings. The household data is a good choice for those who are interested in looking at family effects on work. In addition, the Eurostat data is a version of the LFS that is sent to Europe for comparison with that of other EU countries. The longitudinal datasets are for those who want to exploit the panel design of the survey. The LFS data can be downloaded directly or accessed through Nesstar.
For more information about the LFS see our catalogue pages in Discover: Labour Force Survey.
A related dataset is the Annual Population Survey, which combines variables from the Labour Force Survey with a boost to provide a larger annual sample. In 2011, data are available in a format which allows users to explore the relationship between wellbeing and a range of individual characteristics.
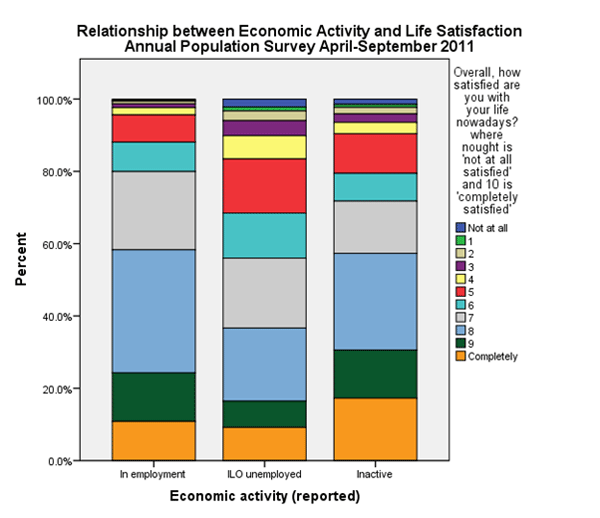
The graph below shows the relationship between economic activity and wellbeing – demonstrating the emotional impact of unemployment. It was produced in SPSS by downloading Annual Population Survey: Subjective Wellbeing, April-September 2011 (SN6994), which is a customised six month dataset designed for wellbeing analysis (more information is availble on the ONS publications release pages). The data contain missing cases and oversampling. Additionally, the wellbeing questions were only asked of adults who had themselves responded to the questionnaire (rather than someone else answering on their behalf). The data were therefore weighted to correct the biases that are introduced by these factors.

When asked how satisfied with their life they are on a scale of 0 to 10 (where 10 is completely satisfied) there is quite a difference between the unemployed and other groups. Comparing the proportion of those who rated their satisfaction at 7 or higher we see that 58 per cent of employed and 57 per cent of inactive counted themselves in this group, compared with a mere 37 per cent of those who were unemployed. However, work cannot be considered a panacea; after all it is the inactive group, including students and homemakers, who are marginally most likely to report being completely happy.
for more information about the APS, see our catalogue pages in Discover: Annual Population Survey
References:
Bell, D.N.F., and Blanchflower, D.G. (2011) ‘Underemployment in the UK in the great recession’, National Institute Economic Review, 215 (1), pp. R23-R33. doi: 10.1177/0027950111401141
Green, A.E., de Hoyos, M., Li, Y., and Owen, D. (2011) Job Search Study: Literature review and analysis of the Labour Force Survey, (Department for Work and Pensions Research Report No 726).
