About the research
Non-response bias is the phenomenon where people with certain characteristics are less likely to respond to a survey and go under-represented in the collected data. For example, people embarrassed or ashamed of their answers are less likely to respond than others. This is a major problem for survey and data-gathering agencies and they are increasingly interested in managing this risk. Low response rates increase the risk of non-response bias, but the reverse is not true – maximising the response rate doesn’t necessarily mitigate non-response bias because non-responders are not representative. Instead it’s better to be able to assess the representativeness of survey data statistically and measure this bias so that it can be controlled for. Techniques that can help to identify and compensate for non-response bias are of great value to data-gathering agencies.
This study was conducted by Dr Jamie Moore, Prof Gabriele Durrant and Prof Peter Smith to investigate indicators of representativeness in survey results and how to use them to compensate for non-response biases. They proposed that surveys can be conducted more efficiently by monitoring the representativeness of the dataset during collection, thereby identifying the point a survey can be ended early without negatively affecting the dataset’s quality.
The project was presented and discussed at the first instalment of The Data Dialogue, a Science and Engineering South event in July 2016, alongside representatives from the University of Cambridge, the UK Data Service, Kings College London and other representatives from academia.
The research findings provide insight for survey organisations looking to use their resources more efficiently.
Methodology
The research was carried out at the Office for National Statistics Secure Research Service. The dataset used for this project was the Office for National Statistics’ (ONS) 2011 Census Non-Response Link Study (CNRLS). Uniquely for the UK, this dataset links ONS social survey sample household members to their concurrent 2011 census records, providing information about their characteristics whether they respond to the survey or not. In addition, details of the number of attempts to interview sample members (“call records”) are included. The researchers monitored data collection in three different surveys: the Labour Force Survey (LFS), Life Opportunities Survey (LOS) and Opinions Survey (OS).
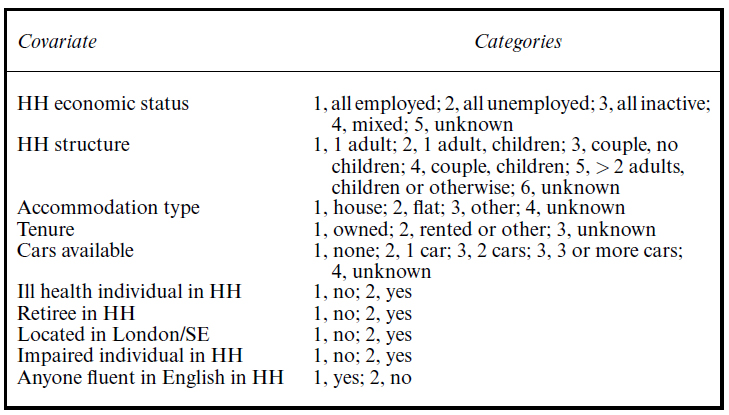
To assess dataset representativeness, the researchers utilised representativeness (R-) indicators and Coefficients of Variation (CVs), two statistical indicators that quantify the extent to which the propensity to respond to a survey varies between people with different characteristics. Indicators can also be used to investigate relationships between characteristics and propensities, with low variation indicating representativeness (see Schouten et al. [2009, 2011, 2012] on representativeness indicators, and the Coefficient of Variation (CV) work of Schouten et al. [2009] and de Heij et al. [2015]). Ten auxiliary covariates were identified in the CNRLS dataset as having the greatest effect on response propensities, and were used for calculating indicators. Indicators were calculated for datasets after one attempt had been made to interview all (non-responding) sample members, after two attempts had been made, after three, and so on up to the dataset maximum of 20 attempts.
Figure 1
Auxiliary household attribute covariates considered in the analyses, and categorisations.
The researchers also sought to identify points in data collection (calls in call records) after which minimal increases in dataset representativeness were observed, known as phase capacity (PC) points. If such points can be identified, there is potential for ending data collection earlier than currently, improving efficiency, without affecting the quality of the dataset. If the techniques to identify these PC points can be generalised across different surveys, they will be of great interest to data-gathering organisations.
Research Findings
Figure 2
R-Indicators and CVs for the LFS, LOS and OPN surveys over the call records can be seen below:
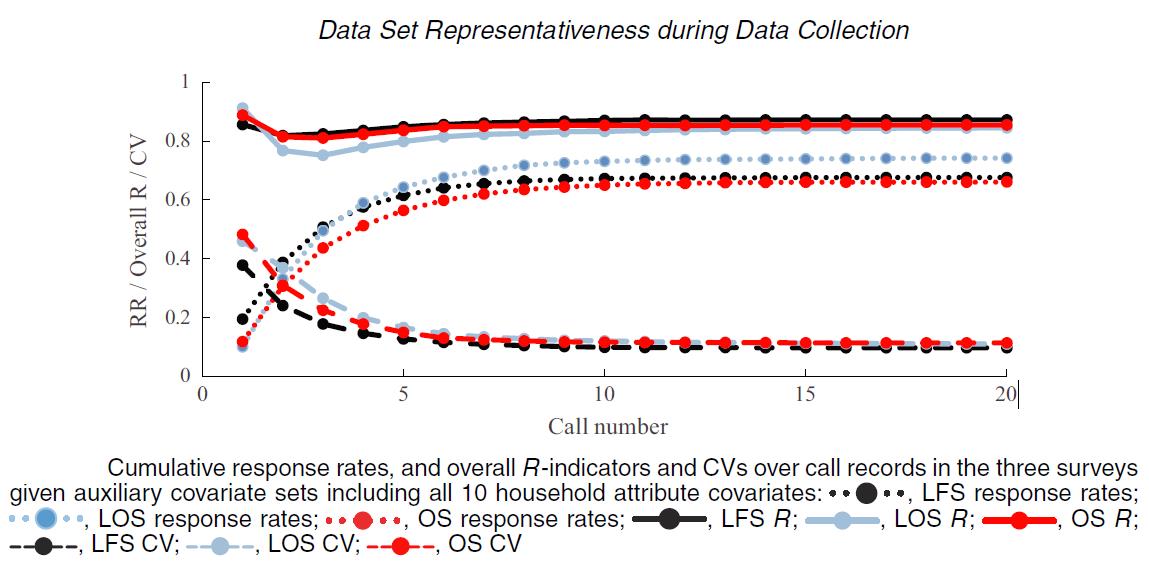
In each survey CVs decreased as response rates increased, indicating an improvement in representativeness over the course of the survey. Indicators suggested that dataset representativeness was highest at early calls, then decreased slightly before increasing again. The R-indicator results though, were noted as being a statistical artefact, and for best results the researchers advised that CVs be used for monitoring data collection.
Concerning whether data collection can be ended early without affecting risks of non-response biases, there was a clear levelling off of CV measured representativeness over call records. Depending on survey and thresholds used to calculate them, PC points ranged from calls five to nine. The researchers estimate that 7-18% of the total calls made are saved by ending data collection at these points. This suggests substantial efficiencies may be possible, though they are likely to vary between surveys.
The biggest cause of non-response bias was found to be under-representation of less contactable households. For one example, households where all inhabitants work and none are retired or suffering ill health – these households were being underrepresented in early calls especially. These findings, emphasise the importance of monitoring dataset composition rather than overall response rates. They also suggest that targeting these households may increase dataset quality and / or lead to further cost savings.
When discussing their findings, the researchers mention that the nature of the CNRLS dataset made their research possible. Computation of the representativeness indicators used to monitor data collection requires attribute information on all survey sample members (i.e. both respondents and non-respondents), for which the 2011 census was an in-depth source. Given the differences observed between studied surveys, suggesting findings are not entirely generalizable, they advocate further research using similar information to monitor data collection in other scenarios. They note though, the necessity of such information being timely: for example, the census data used here will be less accurate concerning household members for survey samples further away from the enumeration date than in the CNRLS.
The researchers noted that, despite the potential benefits of generalising PC points across surveys, this proves difficult even when surveys are of the same sample frame. Their recommendation was that work be done to confirm before generalising PC points from one survey to another.
Impact of the research and findings for policy
The report has contributed to the public body of knowledge and suggested fruitful avenues for future research. It has already been cited by Brick & Tourangeau’s “Responsive Survey Designs for Reducing Nonresponse Bias”.
More than post-hoc analysis on past surveys, the paper also raises the possibility of assessing responses during the survey. Extending or ending the survey in response to representativeness could let survey agencies mitigate the risk of non-response bias dynamically.
The ONS Social Survey team had already expressed interest in some of the work conducted by the researchers done prior to this paper. Now, based on its findings, they have reduced their standard number of interviewer calls for the LFS from 20 to 13. The Social Survey team have also met with Dr Moore to further discuss the research and its implications.
Two presentations based on this paper’s findings took place at The Data Dialogue in July 2016. One focussed on the processes and results of the paper, while the other described how its findings can be used to support research practices. Both videos can be seen in the “Publications and Outputs” link.
Read the Report
The full paper “Data set representativeness during data collection in three UK social surveys: generalizability and the effects of auxiliary covariate choice” can be read at the following location: http://onlinelibrary.wiley.com/doi/10.1111/rssa.12256/full
Publications and outputs
Dr Jamie Moore and Professor Peter W.F.Smith speaking about the paper at Cambridge University event: https://adrn.ac.uk/about/news/newsitem?newsid=4756
Linked papers
J. Michael Brick, Roger Tourangeau “Responsive Survey Designs for Reducing Nonresponse Bias”
https://www.degruyter.com/view/j/jos.2017.33.issue-3/jos-2017-0034/jos-2017-0034.xml