About the research
The creative industries are a high growth sector and make important economic contributions with a Gross Value Added (GVA) of £84.1 billion and accounting for 5.2 % of the whole UK economy. Their GVA grew by 8.9 % between 2013 and 2014, almost twice as fast as the UK as a whole (Department for Culture, Media and Sport, 2016).
Although it is well known that creative industries are engines of growth in big cities such as London, Bristol, Manchester, Edinburgh and Cardiff, their importance in other parts of the UK is less widely appreciated.
Nesta and Creative England produced a report highlighting hotspots of creative activity in all nations and regions of the UK, and providing data that economic development agencies and policymakers in charge of promoting business growth can use when setting strategic priorities. The report maps the concentrations of creative activity in the country and describes important differences that exist between creative clusters.
Findings show that the creative industries are growing more rapidly than other sectors in most parts of the country. Rapid growth has been experienced in all sub-sectors that make up the creative industries, but particularly in services activities like Design, Software and digital, and Advertising.
The study identified 47 creative clusters in the UK, as shown in Map 1 – see the interactive map of the geography of creativity in the UK.
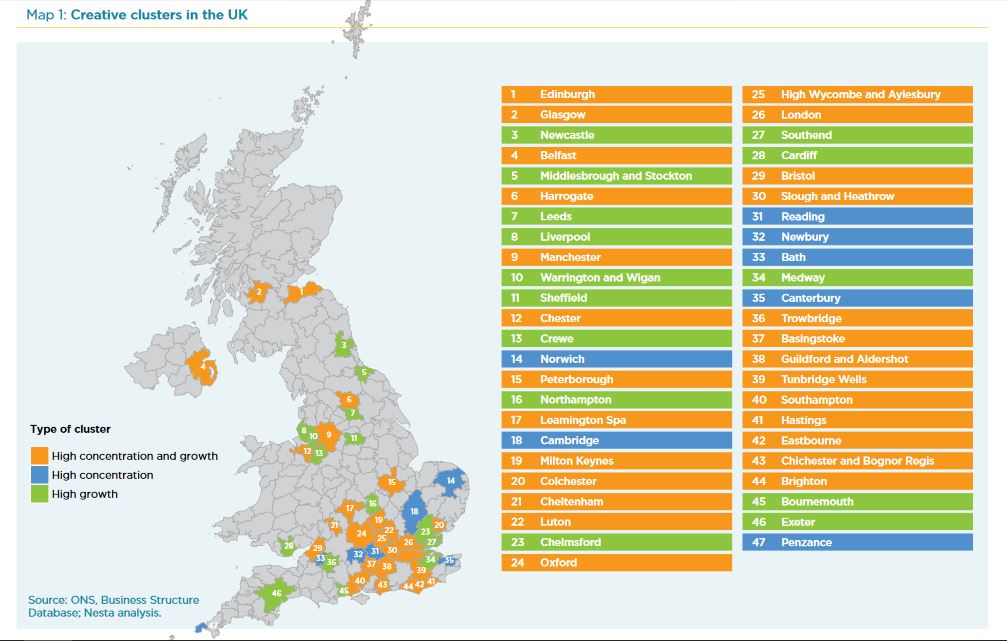
The map confirms that creative clusters have a dominant presence in London and the South-East of England – which together comprise around a third of clusters identified. However, over one-fifth of clusters are also found in the North of England, and Scotland, Wales and Northern Ireland.
The report also documents the significant levels of relevant university activity in both education and research that takes place in the UK’s creative clusters.
Using data from online events platform Meetup.com, the report also highlights the importance of networking activity in the UK’s creative industries. Findings show an explosion of meetup activity in the creative industries and that creative cities display higher levels of international networking.
Methodology
The report uses a number of official data sources available from the UK Data Service, combined with geographical analysis of data on the supply of university graduates and research, and analysis of social networking activity.
The study measured business activity for the 2007-2014 period, using the Business Structure Database (BSD), which contains location, employment and turnover information about most registered businesses in the UK and has complemented BSD data with jobs figures from the Annual Population Survey (APS). GVA figures were estimated using detailed location and financial data from the Annual Business Survey.
In terms of geographies, the analysis was conducted at the level of the Travel-to-Work-Area (TTWA), ONS geographies bounding local labour markets based on commuting patterns from the UK 2011 Census.
HESA data about qualifiers from UK universities between the periods 2010/2011 – 2013/2014 were used to analyse local employable labour supply and the Higher Education Business-Community Interaction Survey was used to obtain information about knowledge exchange and third stream activities in 161 UK universities. Additionally, the Research Excellence Framework results contained an evaluation of quality of research at UK departments in different disciplines.
Data about social network activity was obtained from Meetups’ Groups and Members API. The data contained information about all groups in the tech and business categories and the study used an unsupervised machine learning method (Dirichilet Latent Allocation), to model the topics of these groups using the labels that their organisers used to describe them.
Findings for policy
Findings of the study show that the creative industries are gaining in economic importance right across the UK. However, the report also recommends that more should be done to strengthen the UK’s creative clusters and that policymakers, support agencies and trade bodies “need to recognise the important and growing role of creative conurbations in the UK’s creative industries, and put in place suitable strategies to help them develop further”.
The report suggests that at the local level governments could take action to boost the creative industries growth that is taking place in the area and incorporate it into their strategy. At the national level the government could play a more active role to scale up creative clusters outside London and the South East, with well-resourced, locally relevant interventions. Additionally, they could explore ways to enhance the beneficial spillovers from collaborations across creative clusters.
Relative scarcity of talent, relevant research and knowledge exchange, as well as low levels of local networking are issues that deserve further attention from local policymakers and stakeholders, as well as national bodies promoting UK creative clusters abroad, such as UKTI and creative industry trade associations.
The study also revealed the importance of international networks of the UK’s creative clusters, particularly with regard to the EU. The authors argue that “ensuring that these connections are maintained in the face of the EU referendum outcome will be an important challenge going forward.”
Impact of the research
Findings of the report have been featured in a press release by Colchester Borough Council: Creative Industries Put Colchester on National Map. Councillor Paul Smith, Leader of the Council, commented: “The Council had identified the creative and digital sectors as strategic priorities for growth in the borough, this is evidence of that this focus is yielding significant progress and development for our town.”
Adur and Worthing Councils have also published the press release Powering the economy through creativity featuring the report. Karen Simporis, Chair of the Adur and Worthing Trust, said: “This is an exciting time for Worthing which looks set to catch the wave of its changing demographic by becoming a centre for Creative industry in the widest sense – i.e. not just artists and makers but also event organisers, gaming, digital and much more.”
The report has also been used by the Arts Council England as evidence in the The arts and culture sector and exit from the European Union report focusing on how the UK’s exit from the EU can deliver the best outcome for arts and culture.
Read the report:
Mateos-Garcia, J. and Bakhshi, H. (2016) The geography of creativity in the UK: Creative clusters, creative people and creative networks. London: NESTA.